Welcome to Data-Driven Ontology Toolkit’s documentation!
The Data-Driven Ontology Toolkit (DDOT) facilitates the inference, analysis, and visualization of biological hierarchies using a data structure called an ontology.
- Open-source Python package under MIT license. Supports Python 2.7 or >=3.6.
- The HiView web application visualizes hierarchical structure and the biological evidence for that structure.
Getting started
- Install the DDOT Python package using the instructions on the github page.
- Go through the tutorial.
- Browse a list of Python functions in Ontology Class and Utility Functions.
- Post questions or issues to the Google Groups forum.
Features
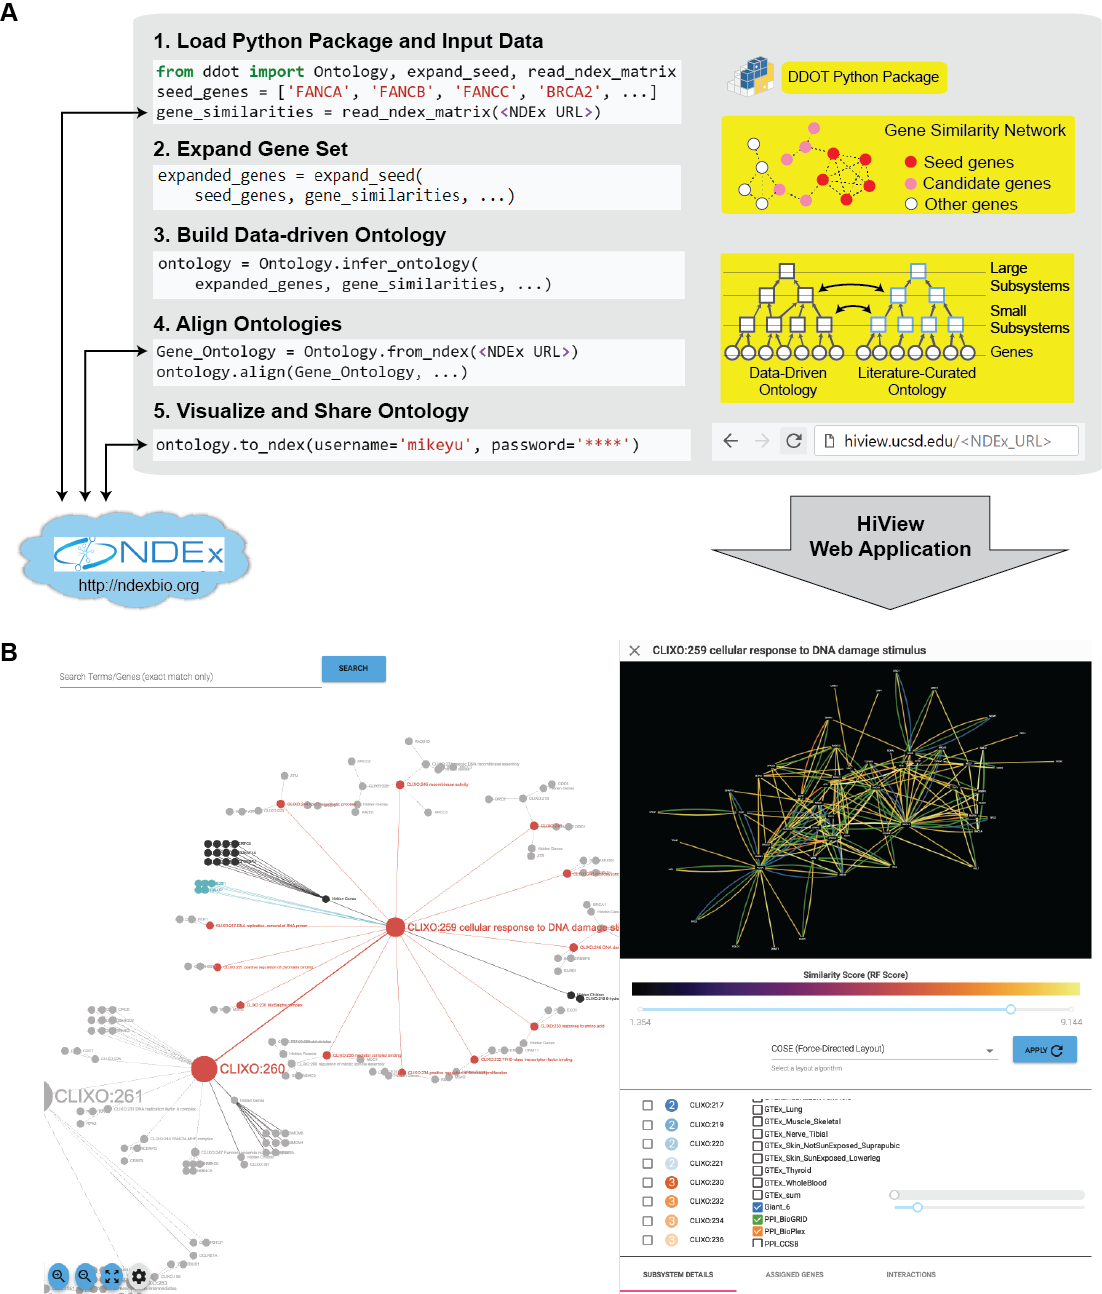
- Build Data-Driven Ontology: Given a set of genes and a gene similarity network, hierarchically cluster the genes to infer cellular subsystems using the CliXO algorithm (Kramer et al. Bioinformatics 2014). The resulting hierarchy of subsystems defines a data-driven ontology.
- Align Ontologies: Annotate a data-driven ontology by aligning it to a curated ontology such as the Gene Ontology (GO). For instance, if a data-driven subsystem contains a similar set of genes as the GO term for DNA repair, then annotate this subsystem as being involved in DNA repair. Data-driven subsystems with no such matches represent new molecular mechanisms.
- Visualize Hierarchical Structure: Browse the full hierarchical structure of a data-driven ontology, including the network of gene similarities used to infer it, in a web application called the Hierarchical Viewer (HiView, http://hiview.ucsd.edu)
- Examine ontology structure: For each subsystem, retrieve its hierarchical connections (genes, child and descendant subsystems, parent and ancestral subsystems) and the subnetwork of gene similarities that supports the subsystem’s existence. For each gene, retrieve its set of subsystems.
- Modify ontology structure: Reduce the size of an ontology by removing a set of subsystems or genes. Randomize connections between genes and subsystems to create new ontologies representing a null model for statistical tests.
- Flatten ontology structure: Instead of inferring an ontology from a gene similarity network, perform the reverse process of inferring a gene similarity network from an ontology. In particular, the similarity between two genes is calculated as the size of the smallest common subsystem, known as the Resnik score.
- Expand Gene Set: Given a set of genes as a “seed set” and a gene similarity network, identify an expanded set of genes that are highly similar to the seed set. This function can broaden the scope of a data-driven ontology beyond genes that are already well known.
- Map genotypes to the ontology: Given a set of mutations comprising a genotype, propagate the impact of these mutations to the subsystems containing these genes in the ontology. In particular, the impact on a subsystem is estimated by the number of its genes that have been mutated. These subsystem activities, which we have called an “ontotype”, enables more accurate and interpretable predictions of phenotype from genotype (Yu et al. Cell Systems 2016).
- Load curated ontologies: Parse Open Biomedical Ontologies (OBO) and gene-association file (GAF) formats that are typically used to describe curated ontologies like GO.
- Interface with Network Data Exchange: Ontologies and networks can be stored and retrieved online at NDEx (http://ndexbio.org). We encourage use of NDEx to make DDOT-based software pipelines more reproducible and shareeable with others.
- Interface with other tools and Python libraries: DDOT can readily interface with other desktop applications, such as Cytoscape, and other programming libraries in Python, such as the Pandas, NetworkX, igraph, and matplotlib.
How to cite
If you use DDOT for your research, please cite
Yu MK, Ma J, Ono K, Zheng F, Fong S, Gary A, Chen J, Demchak B, Pratt D, Ideker T. DDOT: A Swiss Army Knife for Investigating Data-Driven Biological Ontologies. Cell Systems. 2019 Mar 27;8(3):267-273.
References
- Yu MK, Kramer M, Dutkowski J, Srivas R, Licon K, Kreisberg JF, Ng CT, Krogan N, Sharan R, Ideker T. “Translation of genotype to phenotype by a hierarchy of cell subsystems”. Cell Systems, 2(2), pp.77-88. 2016.
- Kramer M, Dutkowski J, Yu M, Bafna V, Ideker T. “Inferring gene ontologies from pairwise similarity data.” Bioinformatics, 30(12), pp.i34-i42. 2014.
- Kramer MH, Farre JC, Mitra, K, Yu MK, Ono K, Demchak B, Licon K, Flagg M, Balakrishnan R, Cherry JM, Subramani S, Ideker T. “Active Interaction Mapping Reveals the Hierarchical Organization of Autophagy”. Molecular Cell, 65(4), pp.761-774. 2017.
- Dutkowski J, Ono K, Kramer M, Yu M, Pratt D, Demchak B, Ideker T. “NeXO Web: the NeXO ontology database and visualization platform.” Nucleic Acids Research, 42(D1), pp.D1269-D1274. 2013.
- Dutkowski J, Kramer M, Surma MA, Balakrishnan R, Cherry JM, Krogan NJ, Ideker T. “A gene ontology inferred from molecular networks.” Nature Biotechnology, 31(1). 2013.